|
The Reality Perception
Personality Spectrum Ensemble Example - Schizophrenia (v. #3) Select the section that interests you. |
|
|
The Reality Perception
Personality Spectrum Ensemble Example - Schizophrenia (v. #3) Select the section that interests you. |
|
The following was reproduced from
"Biological insights from 108 schizophrenia-associated genetic loci" -
Nature 511, 421-427 (24 July 2014), doi:10.1038/nature13595
Editor's summary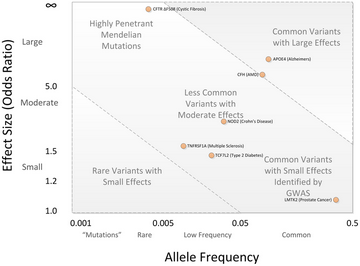
GWA studies typically identify common variants
with small effect sizes (lower right).
Although schizophrenia is a highly heritable disorder, its complex polygenic nature has impeded attempts to establish its genetic basis. This paper reports a genome-wide association study of more than 36,000 schizophrenia patients and 100,000 controls. The study identifies 128 independent associations in 108 loci, 83 of them new. Among them are many genes involved in glutamatergic neurotransmission, highlighting a potential therapeutic avenue. In addition, the results provide support for the hypothesized link between the immune system and schizophrenia.
Associated links
"News & Views Schizophrenia: Genesis of a complex disease", by Flint and Munafò
Quick article navigation links:Abstract
Abstract
Introduction
108 independent associated loci
Characterization of associated loci
The brain and immunity
Overlap with rare mutations
Polygenic risk score profiling
Discussion
References
Acknowledgements
Author information
Extended data figures and tables
Supplementary
Comments
Schizophrenia is a highly heritable disorder. Genetic risk is conferred by a large number of alleles, including common alleles of small effect that might be detected by genome-wide association studies. Here we report a multi-stage schizophrenia genome-wide association study of up to 36,989 cases and 113,075 controls. We identify 128 independent associations spanning 108 conservatively defined loci that meet genome-wide significance, 83 of which have not been previously reported. Associations were enriched among genes expressed in brain, providing biological plausibility for the findings. Many findings have the potential to provide entirely new insights into aetiology, but associations at DRD2 and several genes involved in glutamatergic neurotransmission highlight molecules of known and potential therapeutic relevance to schizophrenia, and are consistent with leading pathophysiological hypotheses. Independent of genes expressed in brain, associations were enriched among genes expressed in tissues that have important roles in immunity, providing support for the speculated link between the immune system and schizophrenia.Introduction
Schizophrenia has a lifetime risk of around 1%, and is associated with substantial morbidity and mortality as well as personal and societal costs (click for references 1, 2, 3). Although pharmacological treatments are available for schizophrenia, their efficacy is poor for many patients (click for reference 4). All available antipsychotic drugs are thought to exert their main therapeutic effects through blockade of the type 2 dopaminergic receptor (click for references 5, 6) but, since the discovery of this mechanism over 60 years ago, no new antipsychotic drug of proven efficacy has been developed based on other target molecules. Therapeutic stasis is in large part a consequence of the fact that the pathophysiology of schizophrenia is unknown. Identifying the causes of schizophrenia is therefore a critical step towards improving treatments and outcomes for those with the disorder.108 independent associated loci
High heritability points to a major role for inherited genetic variants in the aetiology of schizophrenia (click for references 7, 8). Although risk variants range in frequency from common to extremely rare (click for reference 9), estimates (click for references 10, 11) suggest half to a third of the genetic risk of schizophrenia is indexed by common alleles genotyped by current genome-wide association study (GWAS) arrays. Thus, GWAS is potentially an important tool for understanding the biological underpinnings of schizophrenia.
To date, around 30 schizophrenia-associated loci (click for references 10 thru 23) have been identified through GWAS. Postulating that sample size is one of the most important limiting factors in applying GWAS to schizophrenia, we created the Schizophrenia Working Group of the Psychiatric Genomics Consortium (PGC). Our primary aim was to combine all available schizophrenia samples with published or unpublished GWAS genotypes into a single, systematic analysis (click for reference 24). Here we report the results of that analysis, including at least 108 independent genomic loci that exceed genome-wide significance. Some of the findings support leading pathophysiological hypotheses of schizophrenia or targets of therapeutic relevance, but most of the findings provide new insights.Figure 1: Manhattan plot showing schizophrenia associationsWe obtained genome-wide genotype data from which we constructed 49 ancestry matched, non-overlapping case-control samples (46 of European and three of east Asian ancestry, 34,241 cases and 45,604 controls) and 3 family-based samples of European ancestry (1,235 parent affected-offspring trios) (Supplementary Table 1 and Supplementary Methods). These comprise the primary PGC GWAS data set. We processed the genotypes from all studies using unified quality control procedures followed by imputation of SNPs and insertion-deletions using the 1000 Genomes Project reference panel (click for references 25). In each sample, association testing was conducted using imputed marker dosages and principal components (PCs) to control for population stratification. The results were combined using an inverse-variance weighted fixed effects model (click for references 26). After quality control (imputation INFO score ≥ 0.6, MAF ≥ 0.01, and successfully imputed in ≥ 20 samples), we considered around 9.5 million variants. The results are summarized in Figure 1.
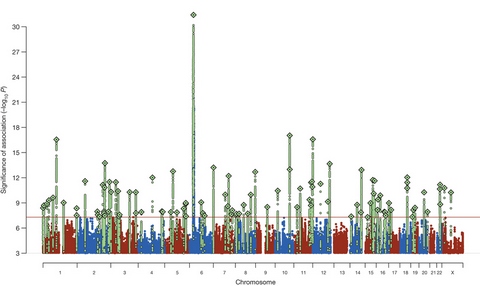
Manhattan plot of the discovery genome-wide association meta-analysis
of 49 case control samples (34,241 cases and 45,604 controls) and 3 family
based association studies (1,235 parent affected-offspring trios). The x axis is
chromosomal position and the y axis is the significance (-log10 P; 2-tailed) of
association derived by logistic regression. The red line shows the genome-wide
significance level (5 × 10⁻⁸). SNPs in green are in linkage disequilibrium with
the index SNPs (diamonds) which represent independent genome-wide
significant associations.
Extended Data Figure 1: Homogeneity of effects across studies.To enable acquisition of large samples, some groups ascertained cases via clinician diagnosis rather than a research-based assessment and provided evidence of the validity of this approach (Supplementary Information) (click for references 11, 13). Post hoc analyses revealed the pattern of effect sizes for associated loci was similar across different assessment methods and modes of ascertainment (Extended Data Figure 1), supporting our a priori decision to include samples of this nature.
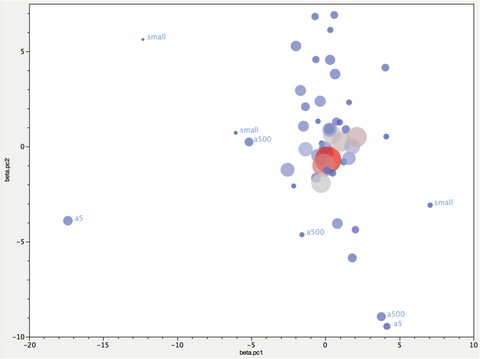
Plot of the first two principal components (PCs) from principal components
analysis (PCA) of the logistic regression β coefficients for autosomal
genome-wide significant associations. The input data were the β coefficients
from 52 samples for 112 independent SNP associations (excluding 3 chrX
SNPs and 13 SNPs with missing values in Asian samples). PCAs were weighted
by the number of cases. Each circle shows the location of a study on PC1 and PC2.
Circle size and colour are proportional to the number of cases in each sample
(larger and darker red circles correspond to more cases). Most samples cluster.
Outliers had either small numbers of cases ('small') or were genotyped on older
arrays. Abbreviations: a500 (Affymetrix 500K); a5 (Affymetrix 5.0). Studies that
did not use conventional research interviews are in the central cluster (CLOZUK,
Sweden, and Denmark-Aarhus studies, see Supplementary Methods for sample
descriptions).
For the subset of linkage-disequilibrium-independent single nucleotide polymorphisms (SNPs) with P < 1 × 10⁻⁶ in the meta-analysis, we next obtained results from deCODE genetics (1,513 cases and 66,236 controls of European ancestry). We define linkage-disequilibrium-independent SNPs as those with low linkage disequilibrium (r2 < 0.1) to a more significantly associated SNP within a 500-kb window. Given high linkage disequilibrium in the extended major histocompatibility complex (MHC) region spans ∼8 Mb, we conservatively include only a single MHC SNP to represent this locus. The deCODE data were then combined with those from the primary GWAS to give a data set of 36,989 cases and 113,075 controls. In this final analysis, 128 linkage-disequilibrium-independent SNPs exceeded genome-wide significance (P ≤ 5 × 10⁻⁸) (→ Supplementary Table 2 ←).
Extended Data Figure 2: Quantile-quantile plot.As in meta-analyses of other complex traits which identified large numbers of common risk variants (click for references 27, 28), the test statistic distribution from our GWAS deviates from the null (Extended Data Figure 2). This is consistent with the previously documented polygenic contribution to schizophrenia (click for references 10, 11). The deviation in the test statistics from the null (λGC = 1.47, λ1000 = 1.01) is only slightly less than expected (λGC = 1.56) under a polygenic model given fully informative genotypes, the current sample size, and the lifetime risk and heritability of schizophrenia (click for reference 29).
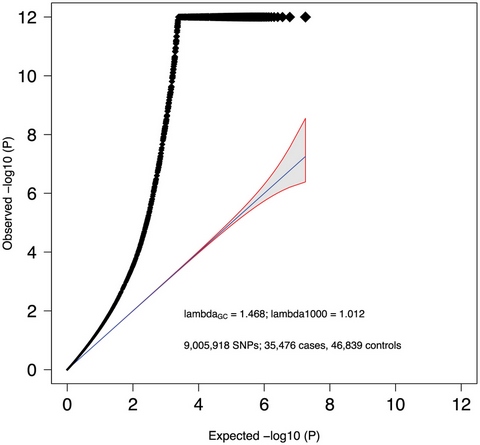
Quantile-quantile plot of the discovery genome-wide association meta-analysis
of 49 case control samples (34,241 cases and 45,604 controls) and 3 family based
association studies (1,235 parent affected-offspring trios). Expected -log10 P values
are those expected under the null hypothesis. Observed are the GWAS association
results derived by logistic regression (2-tailed) as in Fig. 1. For clarity, we avoided
expansion of the y axis by setting the smallest association P values to 10-12. The
shaded area surrounded by a red line indicates the 95% confidence interval under
the null. λGC is the observed median χ2 test statistic divided by the median expected
χ2 test statistic under the null hypothesis.
Extended Data Figure 3:Additional lines of evidence allow us to conclude the deviation between the observed and null distributions in our primary GWAS indicates a true polygenic contribution to schizophrenia. First, applying a novel method (click for reference 30) that uses linkage disequilibrium information to distinguish between the major potential sources of test statistic inflation, we found our results are consistent with polygenic architecture but not population stratification (Extended Data Figure 3). Second, the schizophrenia-associated alleles at 78% of 234 linkage-disequilibrium-independent SNPs exceeding P < 1 × 10⁻⁶ in the case-control GWAS were again overrepresented in cases in the independent samples from deCODE. This degree of consistency between the case-control GWAS and the replication data is highly unlikely to occur by chance (P = 6 × 10-19). The tested alleles surpassed the P < 10-6 threshold in our GWAS before we added either the trios or deCODE data to the meta-analysis. This trend test is therefore independent of the primary case-control GWAS. Third, analysing the 1,235 parent-proband trios, we again found excess transmission of the schizophrenia-associated allele at 69% of the 263 linkage-disequilibrium-independent SNPs with P < 1 × 10⁻⁶ in the case-control GWAS. This is again unlikely to occur by chance (P < 1 × 10⁻⁹) and additionally excludes population stratification as fully explaining the associations reaching our threshold for seeking replication. Fourth, we used the trios trend data to estimate the expected proportion of true associations at P < 1 × 10⁻⁶ in the discovery GWAS, allowing for the fact that half of the index SNPs are expected to show the same allelic trend in the trios by chance, and that some true associations will show opposite trends given the limited number of trio samples (Supplementary Methods). Given the observed trend test results, around 67% (95% confidence interval: 64-73%) or n = 176 of the associations in the scan at P < 1 × 10⁻⁶ are expected to be true, and therefore the number of associations that will ultimately be validated from this set of SNPs will be considerably more than those that now meet genome-wide significance. Taken together, these analyses indicate that the observed deviation of test statistics from the null primarily represents polygenic association signal and the considerable excess of associations at the tail of extreme significance largely correspond to true associations.
Linkage disequilibrium score regression consistent with
polygenic inheritance.
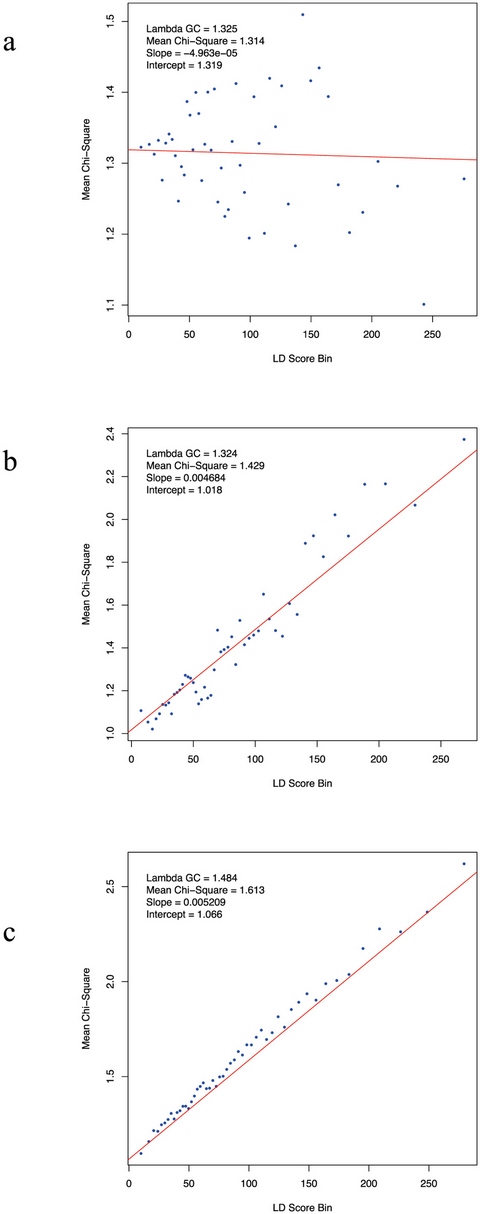
The relationship between marker χ2 association statistics and linkage disequilibrium
(LD) as measured by the linkage disequilibrium score. Linkage disequilibrium score
is the sum of the r2 values between a variant and all other known variants within a 1cM
window, and quantifies the amount of genetic variation tagged by that variant. Variants
were grouped into 50 equal-sized bins based on linkage disequilibrium score rank.
Linkage disequilibrium score bin and mean χ2 denotes mean linkage disequilibrium
score and test statistic for markers each bin. a, b, We simulated (Supplementary
Methods) test statistics under two scenarios: a, no true association, inflation due to
population stratification; and b, polygenic inheritance (λ = 1.32), in which we
assigned independent and identically distributed per-normalized-genotype effects to
a randomly selected subset of variants. c, Results from the PGC schizophrenia GWAS
(λ = 1.48). The real data are strikingly similar to the simulated data summarized in b
but not a. The intercept estimates the inflation in the mean χ2 that results from
confounding biases, such as cryptic relatedness or population stratification. Thus,
the intercept of 1.066 for the schizophrenia GWAS suggests that ~90% of the inflation
in the mean χ2 results from polygenic signal. The results of the simulations are also
consistent with theoretical expectation (see Supplementary Methods). λ is the median
χ2 test statistic from the simulations (a, b) or the observed data (c) divided by the
median expected χ2 test statistic under the null hypothesis.
Independently associated SNPs do not translate to well-bounded chromosomal regions. Nevertheless, it is useful to define physical boundaries for the SNP associations to identify candidate risk genes. We defined an associated locus as the physical region containing all SNPs correlated at r2 > 0.6 with each of the 128 index SNPs. Associated loci within 250kb of each other were merged. This resulted in 108 physically distinct associated loci, 83 of which have not been previously implicated in schizophrenia and therefore harbour potential new biological insights into disease aetiology (→ Supplementary Table 3 ←; regional plots in Supplementary Fig. 1). The significant regions include all but 5 loci previously reported to be genome-wide significant in large samples (→ Supplementary Table 3 ←).
Characterization of associated lociOf the 108 loci, 75% include protein-coding genes (40%, a single gene) and a further 8% are within 20 kb of a gene (→ Supplementary Table 3 ←). Notable associations relevant to major hypotheses of the aetiology and treatment of schizophrenia include DRD2 (the target of all effective antipsychotic drugs) and many genes (for example, GRM3, GRIN2A, SRR, GRIA1) involved in glutamatergic neurotransmission and synaptic plasticity. In addition, associations at CACNA1C, CACNB2 and CACNA1I, which encode voltage-gated calcium channel subunits, extend previous findings implicating members of this family of proteins in schizophrenia and other psychiatric disorders (click for references 11, 13, 31, 32). Genes encoding calcium channels, and proteins involved in glutamatergic neurotransmission and synaptic plasticity have been independently implicated in schizophrenia by studies of rare genetic variation (click for references 33, 34, 35), suggesting convergence at a broad functional level between studies of common and rare genetic variation. We highlight in the Supplementary Discussion genes of particular interest within associated loci with respect to current hypotheses of schizophrenia aetiology or treatment (although we do not imply that these genes are necessarily the causal elements).The brain and immunity
For each of the schizophrenia-associated loci, we identified a credible causal set of SNPs (for definition, see Supplementary Methods) (click for reference 36). In only 10 instances (Supplementary Table 4) was the association signal credibly attributable to a known non-synonymous exonic polymorphism. The apparently limited role of protein-coding variants is consistent both with exome sequencing findings (click for reference 33) and with the hypothesis that most associated variants detected by GWAS exert their effects through altering gene expression rather than protein structure (click for references 37, 38) and with the observation that schizophrenia risk loci are enriched for expression quantitative trait loci (eQTL) (click for reference 39).
To try to identify eQTLs that could explain associations with schizophrenia, we merged the credible causal set of SNPs defined above with eQTLs from a meta-analysis of human brain cortex eQTL studies (n = 550) and an eQTL study of peripheral venous blood (n = 3,754) (click for reference 40) (Supplementary Methods). Multiple schizophrenia loci contained at least one eQTL for a gene within 1 Mb of the locus (Supplementary Table 4). However, in only 12 instances was the eQTL plausibly causal (two in brain, and nine in peripheral blood, one in both). This low proportion suggests that if most risk variants are regulatory, available eQTL catalogues do not yet provide power, cellular specificity, or developmental diversity to provide clear mechanistic hypotheses for follow-up experiments.Figure 2: Enrichment in enhancers of credible SNPs.To further explore the regulatory nature of the schizophrenia associations, we mapped the credible sets (n = 108) of causal variants onto sequences with epigenetic markers characteristic of active enhancers in 56 different tissues and cell lines (Supplementary Methods). Schizophrenia associations were significantly enriched at enhancers active in brain (Figure 2) but not in tissues unlikely to be relevant to schizophrenia (for example, bone, cartilage, kidney and fibroblasts). Brain tissues used to define enhancers consist of heterogeneous populations of cells. Seeking greater specificity, we contrasted genes enriched for expression in neurons and glia using mouse ribotagged lines (click for reference 41). Genes with strong expression in multiple cortical and striatal neuronal lineages were enriched for associations, providing support for an important neuronal pathology in schizophrenia (Extended Data Figure 4) but this is not statistically more significant than, or exclusionary of, contributions from other lineages (click for reference 42).
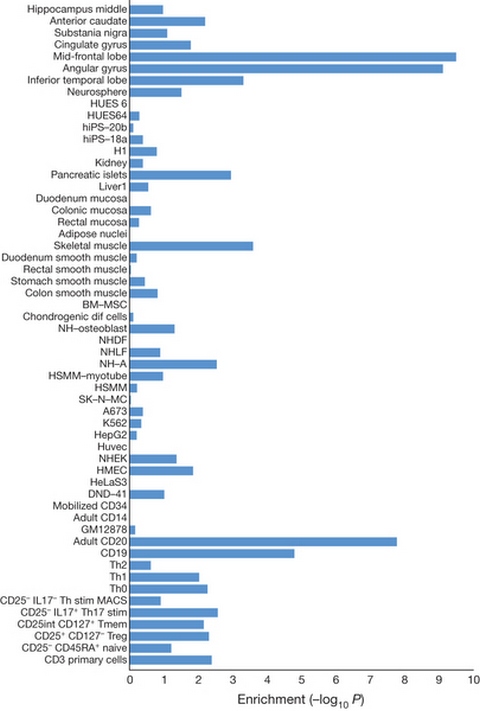
Cell and tissue type specific enhancers were identified using ChIP-seq data sets
(H3K27ac signal) from 56 cell line and tissue samples (y axis). We defined cell and
tissue type enhancers as the top 10% of enhancers with the highest ratio of reads in
that cell or tissue type divided by the total number of reads. Enrichment of credible
causal associated SNPs from the schizophrenia GWAS was compared with frequency
matched sets of 1000 Genomes SNPs (Supplementary Methods). The x axis is the
-log10 P for enrichment. P values are uncorrected for the number of tissues or cells
tested. A -log10 P of roughly 3 can be considered significant after Bonferroni
correction. Descriptions of cell and tissue types at the Roadmap Epigenome website.
Extended Data Figure 4:
Enrichment of associations in tissues and cells.
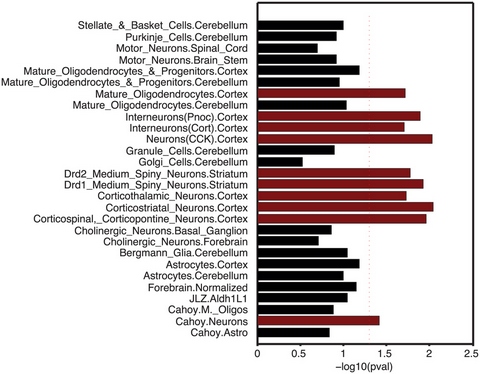
Genes whose transcriptional start is nearest to the most associated SNP at each
schizophrenia-associated locus were tested for enriched expression in purified
brain cell subsets obtained from mouse ribotagged lines (click for reference 41) using
enrichment analysis described in the Supplementary Methods.
The red dotted line indicates P = 0.05.
Schizophrenia associations were also strongly enriched at enhancers that are active in tissues with important immune functions, particularly B-lymphocyte lineages involved in acquired immunity (CD19 and CD20 lines, Figure 2). These enrichments remain significant even after excluding the extended MHC region and regions containing brain enhancers (enrichment P for CD20 < 10-6), demonstrating that this finding is not an artefact of correlation between enhancer elements in different tissues and not driven by the strong and diffuse association at the extended MHC. Epidemiological studies have long hinted at a role for immune dysregulation in schizophrenia, the present findings provide genetic support for this hypothesis (click for reference 43).
Extended Data Table 1: ALIGATOR and INRICH:To develop additional biological hypotheses beyond those that emerge from inspection of the individual loci, we further undertook a limited mining of the data through gene-set analysis. However, as there is no consensus methodology by which such analyses should be conducted, nor an established optimal significance threshold for including loci, we sought to be conservative, using only two of the many available approaches (click for references 44, 45) and restricting analyses to genes within genome-wide significant loci. Neither approach identified gene-sets that were significantly enriched for associations after correction for the number of pathways tested ( Supplementary Table 5) although nominally significantly enrichments were observed among several predefined candidate pathways (Extended Data Table 1). A fuller exploratory analysis of the data will be presented elsewhere.
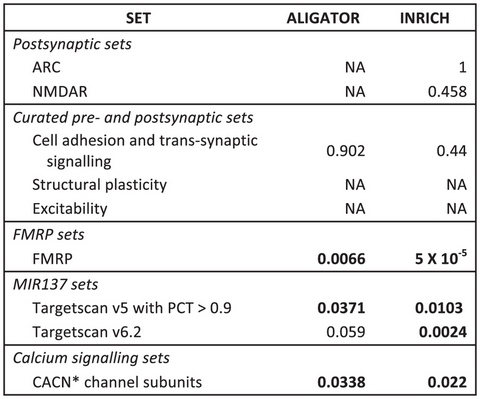
Gene sets that have been reported to be enriched for schizophrenia associations and
or rare mutations were tested for enrichment for genome-wide significant associations
using ALIGATOR (click for reference 44) and INRICH (click for reference 45).
Specifically, we tested the glutamatergic postsynaptic proteins comprising activity-
regulated cytoskeleton-associated protein (ARC) and N-methyl-d-aspartate receptor
(NMDAR) complexes (click for references 33, 34, 35), other curated synaptic
gene-sets (click for references 14, 49), targets of fragile X mental retardation protein
(FMRP) (click for references 33, 34, 35), calcium channels (click for references
11, 33), and TargetScan predicted MIR137 sets (click for references 11, 16). The
MIR137 TargetScan sets contain computationally predicted conserved miRNA
target sites in 3' UTRs of human genes (click for reference 50). The current version
is v6, but the version used in the prior PGC SCZ report (click for reference 16) was
based on v5 (filtered for a probability of conserved targeting > 0.9). We report the
results of both analyses for consistency with previous work. The association at the
extended MHC complex was not included given the extensive linkage disequilibrium
at this region spans large numbers of genes. NA means that the pathway in question
contained fewer than 2 significant genes (for ALIGATOR) or regions (INRICH).
Overlap with rare mutationsExtended Data Table 2: de novo overlapCNVs associated with schizophrenia overlap with those associated with autism spectrum disorder (ASD) and intellectual disability (click for reference 9), as do genes with deleterious de novo mutations (click for reference 34). Here we find significant overlap between genes in the schizophrenia GWAS associated intervals and those with de novo non-synonymous mutations in schizophrenia (P = 0.0061) (Extended Data Table 2), suggesting that mechanistic studies of rare genetic variation in schizophrenia will be informative for schizophrenia more widely. We also find evidence for overlap between genes in schizophrenia GWAS regions and those with de novo non-synonymous mutations in intellectual disability (P = 0.00024) and ASD (P = 0.035), providing further support for the hypothesis that these disorders have partly overlapping pathophysiologies (click for references 9, 34).
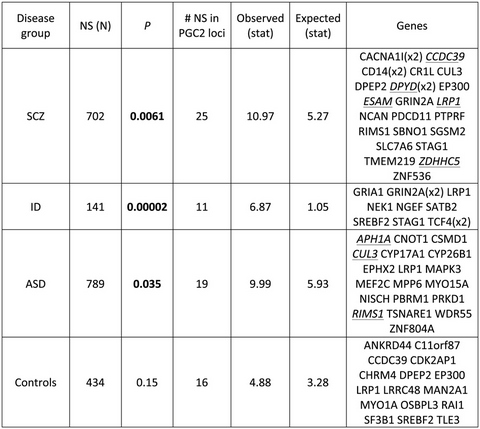
Test of overlap between genes mapping to schizophrenia-associated loci in the present
study and genes affected by non-synonymous (NS) de novo mutations. Enrichment
was calculated using the dnenrich permutation framework as described (click for
reference 34). Genes within the GWS loci (Supplementary Table 3) were weighted by
1/N, where N is the number of coding genes within each associated locus. The
observed test statistic (stat) is the sum of weights of genes impacted by de novo
mutations. The expected test statistics are calculated by averaging over 50,000
permuted de novo mutation sets. Genes within schizophrenia-associated loci affected
by de novo mutations are listed (multiple hits listed in parentheses).
Cohorts: SCZ, schizophrenia; ID, intellectual disability; ASD, autism spectrum disorder.
All mutations analysed annotated according to a unified system (see Supplementary
Tables 1 and 2 of (reference 34)). Genes with loss-of-function de novo mutations
are underlined and in italics.
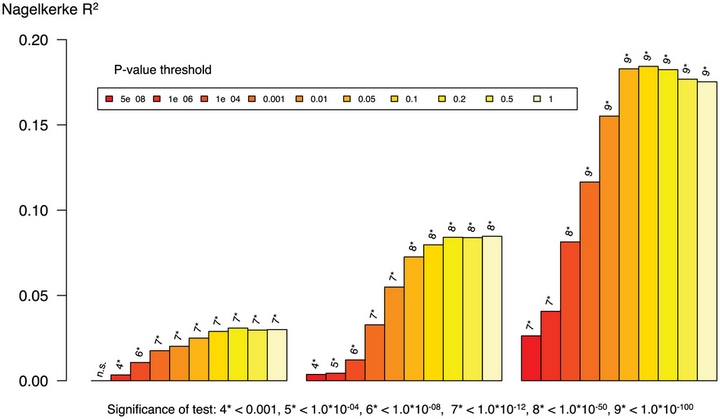
Polygenic risk score profilingDiscussionExtended Data Figure 5: MGS risk profile score analysis.Previous studies have shown that risk profile scores (RPS) constructed from alleles showing modest association with schizophrenia in a discovery GWAS can predict case-control status in independent samples, albeit with low sensitivity and specificity (click for references 10, 11, 16). This finding was robustly confirmed in the present study. The estimate of Nagelkerke R2 (a measure of variance in case-control status explained) depends on the specific target data set and threshold (PT) for selecting risk alleles for RPS analysis (Extended Data Figure 5 and 6a). However, using the same target sample as earlier studies and PT = 0.05, R2 is now increased from 0.03 (click for reference 10) to 0.184 (Extended Data Figure 5). Assuming a liability-threshold model, a lifetime risk of 1%, independent SNP effects, and adjusting for case-control ascertainment, RPS now explains about 7% of variation on the liability scale (click for reference 46) to schizophrenia across the samples (Extended Data Figure 6b), about half of which (3.4%) is explained by genome-wide significant loci.
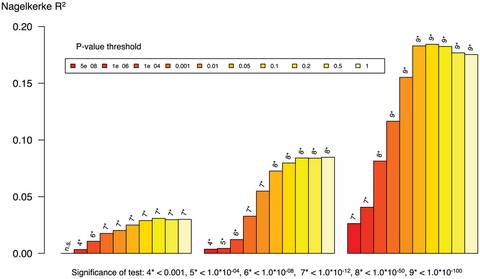
Polygenic risk profile score (RPS) analyses using the MGS (click for reference 18)
sample as target, and deriving risk alleles from three published schizophrenia data sets
(x axis): ISC (2,615 cases and 3,338 controls)10, PGC1 (excluding MGS, 9,320 cases
and 10,228 controls) (click for reference 16), and the current meta-analysis (excluding
MGS) with 32,838 cases and 44,357 controls. Samples sizes differ slightly from the
original publications due to different analytical procedures. This shows the increasing
RPS prediction with increasing training data set size reflecting improved precision of
estimates of the SNP effect sizes. The proportion of variance explained (y axis;
Nagelkerke's R2) was computed by comparison of a full model (covariates + RPS)
score to a reduced model (covariates only). Ten different P value thresholds (PT) for
selecting risk alleles are denoted by the colour of each bar (legend above plot). For
significance testing, see the bottom legend which denotes the P value for the test that
R2 is different from zero. All numerical data and methods used to generate these plots are
available in Supplementary Table 6 and Supplementary Methods.
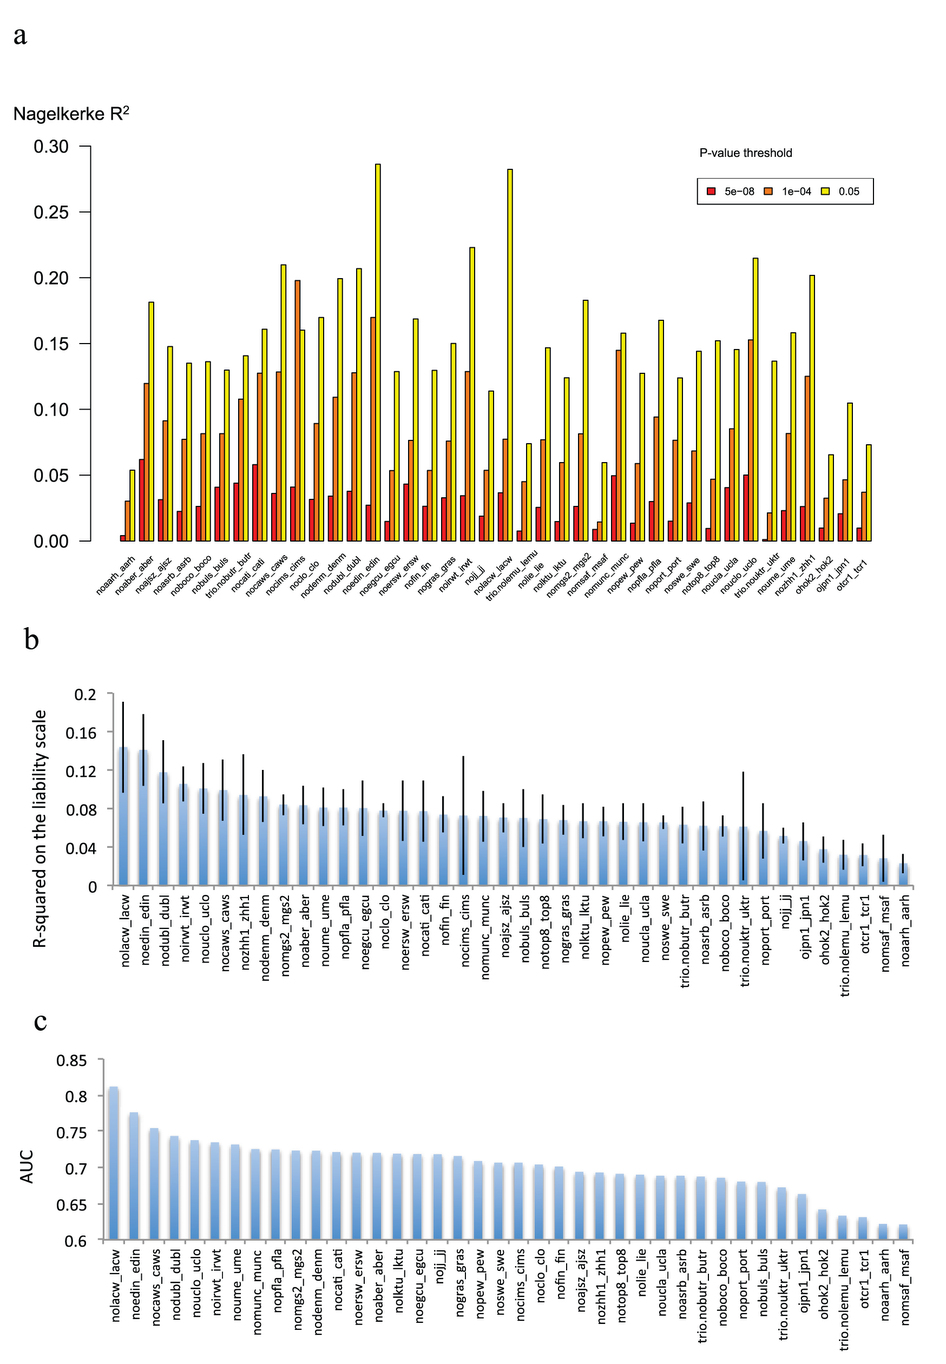
Extended Data Figure 6: Risk profile score analysis.
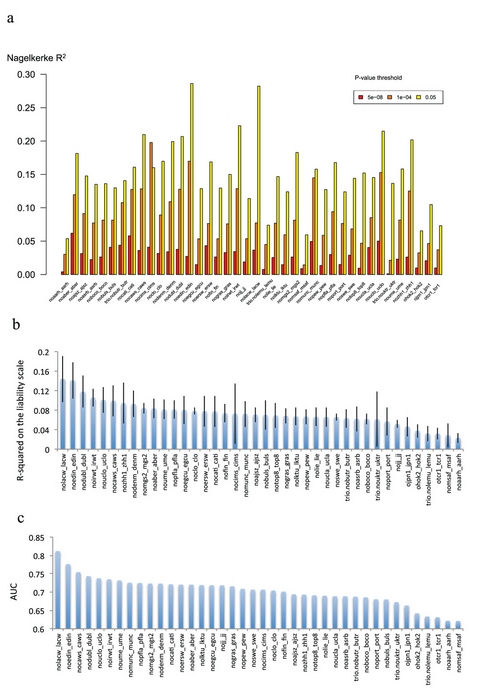
We defined 40 target subgroups of the primary GWAS data set and performed 40
leave-one-out GWAS analyses (see Supplementary Methods and Supplementary
Table 7) from which we derived risk alleles for RPS analysis (x axis) for each target
subgroup. a, The proportion of variance explained (y axis; Nagelkerke's R2) was
computed for each target by comparison of a full model (covariates + RPS) score to
a reduced model (covariates only). For clarity, 3 different P value thresholds (PT)
are presented denoted by the colour of each bar (legend above plot) as for Extended
Data Figure 5, but for clarity we restrict to fewer P value thresholds (PT of 5 × 10⁻⁸,
1 × 10⁻⁴ and 0.05) and removed the significance values. b, The proportion of
variance on the liability scale from risk scores calculated at the PT 0.05 with 95%
CI bar assuming baseline population disease risk of 1%. c, Area under the receiver
operating curve (AUC). All numerical data and methods used to generate these
plots are available in Supplementary Table 7 and Supplementary Methods.
Figure 3: Odds ratio by risk score profile.We also evaluated the capacity of RPS to predict case-control status using a standard epidemiological approach to a continuous risk factor. We illustrate this in three samples, each with different ascertainment schemes (Figure 3). The Danish sample is population-based (that is, inpatient and outpatient facilities), the Swedish sample is based on all cases hospitalized for schizophrenia in Sweden, and the Molecular Genetics of Schizophrenia (MGS) sample was ascertained specially for genetic studies from clinical sources in the US and Australia. We grouped individuals into RPS deciles and estimated the odds ratios for affected status for each decile with reference to the lowest risk decile. The odds ratios increased with greater number of schizophrenia risk alleles in each sample, maximizing for the tenth decile in all samples: Denmark 7.8 (95% confidence interval (CI): 4.4-13.9), Sweden 15.0 (95% CI: 12.1-18.7) and MGS 20.3 (95% CI: 14.7-28.2). Given the need for measures that index liability to schizophrenia (click for references 47, 48), the ability to stratify individuals by RPS offers new opportunities for clinical and epidemiological research. Nevertheless, we stress that the sensitivity and specificity of RPS do not support its use as a predictive test. For example, in the Danish epidemiological sample, the area under the receiver operating curve is only 0.62 (Extended Data Figure 6c, Supplementary Table 6).
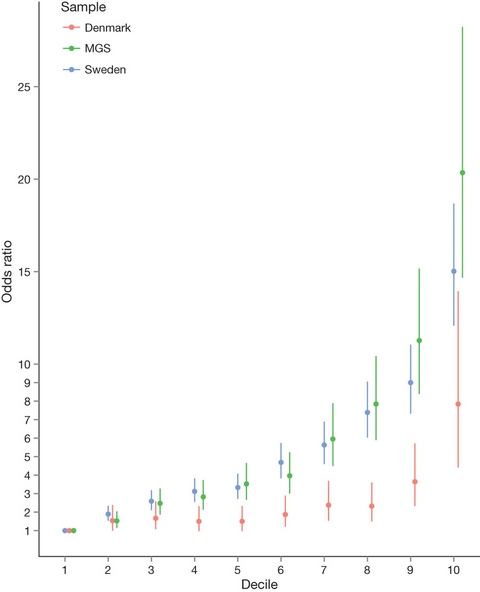
Odds ratio for schizophrenia by risk score profile (RPS) decile in the Sweden
(Sw1-6), Denmark (Aarhus), and Molecular Genetics of Schizophrenia studies
(Supplementary Methods). Risk alleles and weights were derived from 'leave one
out' analyses in which those samples were excluded from the GWAS meta-analysis
(Supplementary Methods). The threshold for selecting risk alleles was PT< 0.05.
The RPS were converted to deciles (1 = lowest, 10 = highest RPS), and nine dummy
variables created to contrast deciles 2-10 to decile 1 as the reference. Odds ratios
and 95% confidence intervals (bars) were estimated using logistic regression with
PCs to control for population stratification.
Extended Data Figure 7:Finally, seeking evidence for non-additive effects on risk, we tested for statistical interaction between all pairs of 125 autosomal SNPs that reached genome-wide significance. P values for the interaction terms were distributed according to the null, and no interaction was significant after correction for multiple comparisons. Thus, we find no evidence for epistatic or non-additive effects between the significant loci (Extended Data Figure 7). It is possible that such effects could be present between other loci, or occur in the form of higher-order interactions.
Pairwise epistasis analysis of significant SNPs.
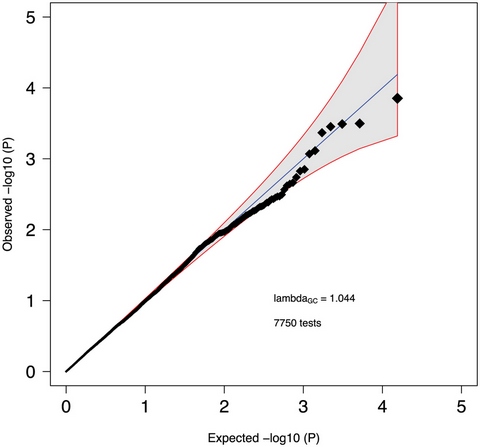
Quantile-quantile plot for all pair-wise (n = 7,750) combinations of the 125 independent
autosomal genome-wide significant SNPs tested for non-additive effects on risk using
case-control data sets of European ancestry (32,405 cases and 42,221 controls). We
included as covariates the principal components from the main analysis as well as a
study indicator. The interaction model is described by:

X1 and X2 are genotypes at the two loci,is the interaction between the two
genotypes modelled in a multiplicative fashion, X4 is the vector of principal
components, X5 is the vector of study indicator variables. Each â is the regression
coefficient in the generalized linear model using logistic regression. The overall
distribution of P values did not deviate from the null and the smallest P value
(4.28 × 10⁻⁴) did not surpass the Bonferroni correction threshold (P = 0.05/7750 =
6.45 × 10⁻⁶). The line x = y indicates the expected null distribution with the grey area
bounded by red lines indicating the expected 95% confidence interval for the null.
In the largest (to our knowledge) molecular genetic study of schizophrenia, or indeed of any neuropsychiatric disorder, ever conducted, we demonstrate the power of GWAS to identify large numbers of risk loci. We show that the use of alternative ascertainment and diagnostic schemes designed to rapidly increase sample size does not inevitably introduce a crippling degree of heterogeneity. That this is true for a phenotype like schizophrenia, in which there are no biomarkers or supportive diagnostic tests, provides grounds to be optimistic that this approach can be successfully applied to GWAS of other clinically defined disorders.References
We further show that the associations are not randomly distributed across genes of all classes and function; rather they converge upon genes that are expressed in certain tissues and cellular types. The findings include molecules that are the current, or the most promising, targets for therapeutics, and point to systems that align with the predominant aetiological hypotheses of the disorder. This suggests that the many novel findings we report also provide an aetiologically relevant foundation for mechanistic and treatment development studies. We also find overlap between genes affected by rare variants in schizophrenia and those within GWAS loci, and broad convergence in the functions of some of the clusters of genes implicated by both sets of genetic variants, particularly genes related to abnormal glutamatergic synaptic and calcium channel function. How variation in these genes impact function to increase risk for schizophrenia cannot be answered by genetics, but the overlap strongly suggests that common and rare variant studies are complementary rather than antagonistic, and that mechanistic studies driven by rare genetic variation will be informative for schizophrenia.→ Click here to open the reference page ←AcknowledgementsCore funding for the Psychiatric Genomics Consortium is from the US National Institute of Mental Health (U01 MH094421). We thank T. Lehner (NIMH). The work of the contributing groups was supported by numerous grants from governmental and charitable bodies as well as philanthropic donation. Details are provided in the Supplementary Notes. Membership of the Wellcome Trust Case Control Consortium and of the Psychosis Endophenotype International Consortium are provided in the Supplementary Notes.Author information→ Click here to open the author information page ← for:Extended Data figures and tablesCorresponding author
- Affiliations
- Consortia - Schizophrenia Working Group of the Psychiatric Genomics Consortium
- Contributions
- Competing financial interests
Correspondence to: Michael C. O'Donovan.
Results can be downloaded from the Psychiatric Genomics Consortium website and visualized using Ricopili. Genotype data for the samples where the ethics permit deposition are available upon application from the NIMH Genetics Repository.Click here to get to Extended Data compilation for this Nature article for:Supplementary Information
- Extended Data Figures
- Extended Data Tables
Click here to get to Supplementary Information compilation for this Nature article.Comments
- PDF files
- Supplementary Information (1.7 MB) - This file contains Supplementary Text, Supplementary Tables 1-3, Supplementary References and Supplementary Notes (including a list of consortium members and acknowledgements) – see contents page for details.
- Supplementary Figure (2.1 MB) - This file contains Supplementary Figure 1.
- Excel files
- Supplementary Table 4 (106 KB) - Credible causal schizophrenia SNPs, coding variants, and eQTLs.
- Worksheet 1: Coding variants: Index SNP is the schizophrenia associated SNP defining the schizophrenia associated region. Coding variant, R2, and gene denotes a coding credible SNP and the R2 with the index SNP, and the gene containing the coding variant. CHR (chromosome), BP (base position), A1A2 (alleles 1 and 2), frequencies of allele 1 (FRQ_A1), INFO (imputation quality) and P (P-value) refer to the index SNP in the discovery GWAS. P (incl rep) refers to replication P value for index SNP.
- Worksheets 2 and 3: Brain and blood eQTL: Credible SNP denotes a SNP within the schizophrenia credible set (defined in supplementary material) that is also a cis eQTL (transcript within 1Mb, PeQTL<1x10⁻⁴). P(cSCZ) is the schizophrenia (discovery) GWAS association P-value for the credible SNP. The Prob(cSCZ) is the normalized probability of the credible variant being causal for schizophrenia. N(cSCZ) is the number of variants in the credible set of schizophrenia variants within a region spanned by eQTLs at P<10-4. eQTL SNP is the most significant expression associated SNP in the region for the gene in next column (N.B., many regions have an eQTL for more than 1 gene). eQTLgene is the gene that is linked to the eQTL SNP. P(eQTL) is the association P-value between the eQTL SNP and the eQTLgene in the previous two columns. Prob(eQTL) is the normalized probability that the eQTL SNP is also the causal SNP for schizophrenia (high values mean higher probability of being causal). eQTLcumsum is the cumulative sum of the probability of all SNPs into the region, up to the inclusion of the max eQTL in locus ordered by probability of being the functional SNP. PeQTL(SCZ) is the schizophrenia association P-value for the eQTL SNP. R2 (cSCZ/ eQTL) is the R2 between the credibleSNP and eQTL SNP. Associations to schizophrenia that are plausibly explained by an eQTL are in bold.
- Separate worksheets provide information on brain and blood eQTL analyses. Distinct loci are alternately shaded/unshaded.
- Supplementary Table 5 (173 KB) - Pathway analyses by ALIGATOR and INRICH. Enrichment analyses using ALIGATOR and INRICH were performed as described in Supplementary Text. Pathway ID denotes the pathway source: GO (Gene ontology; http://www.geneontology.org), KEGG (Kyoto Encyclopaedia of Genes and Genomes; http://www.genome.jp/kegg), PAN-PW (PANTHER; http://www.pantherdb.org/pathway), Reactome (http://www.reactome.org/download), BioCarta (downloaded from the Molecular Signatures Database v4.0 http://www.broadinstitute.org/gsea/msigdb/index.jsp), MGI (Mouse Genome Informatics; http://www.informatics.jax.org), and NCI pathways (NCI: http://pid.nci.nih.gov).
- Supplementary Table 7 (96 KB) - Risk Profile Score Analyses. Risk Profile Score (RPS) analysis was performed as described in supplementary text. RPS datasets tab provides the name given for sample in which RPS was performed (target label) and the datasets included (defined in Supplementary Table 1). The GWAS data used to define the risk alleles for RPS analysis represents the remaining GWAS samples. For various GWAS P-value thresholds (denoted PT), we calculated: 1) the significance of the case-control score difference was analyzed (P tab), 2) the proportion of variance explained (Nagelkerke’s R2, R2 tab), 3) the proportion of variance on the liability scale explained by RPS (h2I tab) with standard error in brackets, 4) area under the receiver operator characteristic curve (AUC tab), and 5) odds ratio for the 10th RPS decile group compared with lowest decile with confidence interval in brackets. Ncases tab denotes number of cases in each target set.
- Supplementary Table 6 (32 KB) - RPS analysis of MGS sample. Risk Profile Score (RPS) analyses was performed using the MGS dataset as target, using three distinct published results for SCZ GWAS, from the (1) ISC (2009) study of 2615 cases and 3338 controls11 (denoted ISC columns) (2) PGC1 (excluding MGS, denoted PGC1 columns) with 9320 cases and 10228 controls22, (3) current meta analysis (excluding MGS, denoted Current columns) with 32838 cases and 44357 controls. For various GWAS P value thresholds (denoted PT), we calculated 1) the significance of the case-control score difference was analyzed (P tab) 2) The proportion of variance explained (Nagelkerke’s R2, R2 tab) 3) The proportion of variance on the liability scale explained by RPS (h2I tab) with standard error in brackets 4) Area under the receiver operator characteristic curve (AUC tab) and 5) Odds ratio for 10th RPS decile group compared with lowest decile with confidence interval in brackets. Ncases tab denotes number of cases in each target set.
Click here to get to Comments compilation for this Nature article.
→ This Summary Article was last updated 28 Nov 2016 16:20 PST ←
 Consider thoughtfully.